Category: Windows Server


If your PC / laptop is taking ages to shut down/reboot, there are multiple areas that we need to focus on in checking to identify the root cause and fix it permanently. In this post I am going to show you the common areas to look at when you are in such situations.


First thing to start with is to fire up the Task manager and identify the resource utilization from the moment you initiate shutdown/reboot. Speaking in context with Windows 8 and 10 versions, launching Task manager will land you at Processes tab by default unless you chose fewer details; if so, click on more details and this will land you at Processes tab. Here key areas to look at is CPU, Memory and Disk processes.

Active programs accessed during your session are generally accessed using Physical memory (RAM) and the other passive/minimized programs will be moved off to page file based on RAM utilization and availability. So, in our case, active programs data we accessed needs to be written off to Disk to commit the tasks we performed just before hitting that shutdown/reboot buttons/commands.


CPU, Memory & Disk resource utilization are heavily dependent on the programs those you accessed during your session and background programs those run as part of OS/software requirements.  Considering an example, I have launched VMware workstation program which consumed about 56GB of my RAM for its operations. Closing the program will not immediately free up used 56 GB of RAM, because the program itself has child processes that needs memory accessed data be written off/committed to the Disk to save the programs state I have left it at.

See below screenshot for your reference:

This is Resource monitor tool (type “resmon” in command prompt to fire this thing up), from this utility you can further check the resource utilizing processes. Take a look at the screenshot above, though the memory usage has come down to 4%, the disk still has read write operations going on it. Sort with “Total (B/sec)” in descending order to see which process is performing operations on disk. In my case VMware workstation uses .vmem files to hold the physical memory of my machine to give those physical RAM resources to Virtual machines I use within the application. Once I shutdown/suspend those VMs running on VMware workstation application, the RAM utilized by the VMs must be saved to disk on .vmem file. This process takes time based on amount of RAM utilized by each VM – the larger VM memory configuration/utilized, the longer time it takes to commit the data off to disk.


Similarly, there are multiple child processes/background tasks that runs in the back-end and until those tasks are completed, the system will not shutdown/reboot. These tasks do not appear on “Shutdown preventing programs” because they are actively working to close the session data. There are a lot of other tools we can use to identify the processes those consuming resources, but the first step to start off is with resource monitor.


I will keep adding more information on this topic, but if you have any queries feel free to comment and I will try to address them.


Cheers!

Chaladi


When attempting to install System Center Virtual Machine Manger 2012/R2, you might get installation failure due to Webdeploy.msi failed with Windows Installer 1603 error code as below:


Looking at the logs, you can see webdeploy is failing to install on the system. The reason it reports is that 3.5 already exist if you take a closer look at the logs. Take a look at the logs snippet below:

As highlighted above, it reports A newer version of Web Deploy was found on this machine. To resolve the installation issue, you must navigate to Programs and Features and uninstall the Web Deploy from there. Once this is uninstalled, you can retry the SCVMM installation and it must pass the web deploy issue now.

The reason why a newer version exists can be related to either SCVMM 2016 has been previously attempted to install on this system, or part of web deploy components have been installed for other application requirements.


Some of the IT people overlook this SID attribute of a machine forgetting the importance of unique SID/GUID requirements.

1. Try creating a clone of VM in Hyper-V or VMware Workstation and have them in Workgroup and see if you can enable communication between two clones
2. Try join the same clone VMs into Lab based domain and see how it goes
3. With domain user accounts added in the VM’s Lusrmgr.msc, post AD join and logging into VM with one of AD account and then demoting VM from domain, and then try to do a sysprep with domain accounts still there in local user accounts, and see if you can run sysprep successfully

Please do this Labwork and comment your results…

Just a sneak peak at the SID error…

sid-err-crp


We’re gonna solve the DHCP server authorization issue in this post. Error code looks like below:

“The authorization of DHCP Server failed with Error Code: 20070. The DHCP service couldn’t contact Active Directory.”

dhcp-post-config-20070 error

This is possibly due to user permissions on AD. Ensure you input Domain Administrator (DA) Credentials in the DHCP Commit dialog box, instead of proceeding with logged in account. There are chances that though you logged into DC using some user credentials, it doesn’t necessarily mean you are DA/EA. It could just be an account Admin locally, but not on Domain/forest. Check the DA user in ADUC and ensure you input those credentials to solve this.

Other things you should try if the credentials are DA is, ensure AD services are up and running. Check launching ADUC, Try Restarting DHCP Server services, Try re-installing DHCP from server manager. If you still encounter any issues, please message here, so we can further look into it to get it resolved.

Cheers!
Chaladi

Howdy! Today’s blog post is all about Microsoft’s Windows Server Failover Clustering. I’ve noticed that there are a couple of limitations in Windows Server Failover Clustering (WSFC). I am gonna keep adding the identified limitations, so keep checking.


First of all Shared VHDX issue. Shared VHDX is a clustering storage feature introduced in 2012R2 for windows server cluster participating nodes. If you’re wondering what is Shared VHDX and how it works, Please see here


So, now say, in a 2 node Shared VHDX cluster, you attach 4 Disks to the cluster resource, that is SQL considered as an example here, and both the cluster nodes have these 4 disks in Shared VHDX mode. This will help present the storage as Shared storage, so both the nodes in the cluster can see them. Now if I wanted to move the SQL form Node A to Node B, then all the Shared VHDXs on SQL owning Node will go to Reserve state and will come online on Node B, since we have moved the SQL to node B; and eventually SQL associated Disks and components will move.

Cluster Resource Move failure

Now, if for some reason, one of shared disks are not presented to Node B via Hyper-V manager settings, then Failing over the SQL to Node B will fail to move to Node B. The only error you get is “Cluster disk not connected”. And generating the cluster logs via powershell using “get-clusterlog -uselocatime -timespan 5 -destination D:\logs” too results the below logs.


“ERR   [RCM] rcm::RcmApi::MoveGroup: ERROR_CLUSTER_DISK_NOT_CONNECTED(5963)’ because of ‘Move of group SQL Server (MSSQLSERVER) to node CLUSTERNODE2 is not approved’”


Now the limitation I’m talking about here is, the cluster is not helping out you identify which exact Shared VHDX is not visible to the Node B. So, if Disk 2 is not presented to Node B, then the cluster knows in the background that it is failing to bring the cluster Disk 2 on Node B, so it should log all that “Bringing Disk 1 online on Node X — Pass, Bringing Disk 2 Online on Node X…” like so, that will help you identify the missing Shared VHDX on the Nodes.

In the above command I’ve used timespan of 5 minutes to pull logs regarding cluster. This avoid me generating a big file and to read all the unwanted stuff, since I’ve just tried to move the SQL off of Node A within the last 5 minutes.

Now, you may feel that you can use Disk management to see the Disks differences, but it works if you have few disks and they all represent different data sizes. If you have 15 or like Storage disks presented via Hyper-V and then almost all are same size, like 500 GB in sizes, then it would be kinda time waste to go through all those disk numbers comparing the disks on each nodes side by side.


Now, when I say limitation in Shared VHDX perspective, it could also apply to SAN storage presented via EMC powerpath or like that to the Cluster Nodes. But in that SAN storage directly presented to Cluster node, we can use Powerpath console to identify the disks missing using the reference naming convention used to label disks pushed to the cluster nodes while zoning. But it is still I feel a limitation exists in Windows clustering that is much needed to address at earliest.


And here, with Shared VHDX there’s a big issue with the Redirected I/Os that will kill your critical applications because of poor disk performance. A heavy disk utilising cluster resource must not use Shared VHDx as its storage for this reason. I will write more about this Redirected IOs issue in a separate post.


Hello, this post gonna be simple and straight – About ESET Smart security. This post should help get you fix that connectivity issues; you were trying to establish a remote desktop session to your desktop/laptop at your home from internet, remotely. You might be using Static Public IP or best utilizing that Dynamic IP with the DDNS services (comment if you would like to see how to use DDNS service to get into your home computer RDP).

For some reasons, ESET isn’t allowing the MSTSC application/3389 port white-listing when you manually setting this up in Advanced settings Or maybe let me put it this way, when you setup the port/mstsc application traffic white-listing, it isn’t working as expected :(. So, firewall Interactive mode to the rescue.

It is very important that you stop all the Internet activity on your Home computer, to avoid getting multiple questions asked by the ESET for network communication. Example: Web browsing and other computer activity stoppage should help you avoid random questions being asked.

ESET Smart Security

ESET Smart Security

Click on “Setup” of ESET smart security and then “Enter Advanced Setup” -> Expand “Network”  And then Click on “Personal Firewall” and then change the Filtering mode to “Interactive mode” and then click “OK”

ESET - 1

Now try to initiate the Remote desktop from Internet to your computer, and then you will get a pop-up in ESET asking if you want to allow or Deny MSTSC.EXE application traffic. Click on Allow, and then once done establishing the session to your computer, change the ESET Firewall settings to “Automatic mode” from “interactive mode”

This helps you avoid answering all the network communications filtering questions again.


Thanks for flying with Chaladi.me 🙂


I have been haunted by this weird TCP spurious retransmissions and TCP DUP ACK issue since past 1 month – It almost started/I’ve noticed on November last week. Our production FTP server is a Red Lion device See here sitting in our manufacturing site, whereas our source servers are hosted on Hyper-V clusters. This setup has no Firewalls; only Cisco Nexus Switches 3064  & 3048 Models – that’s 3 3064’s and 2 3048 models connected in a HA model. Our Hyper-V clusters are connected to Cisco 3064 Switches in HA model; 2 Nic cables pulled from each VM Host to 2 3064 Switches for HA. Red Lion – FTP/HTTP device has been attached to 3048 model. These 3064’s are connected to the 3048 Switches directly – no firewalls.

STP is configured properly and running A-okay. Other than Red Lion device, I was able to route traffic as desired and can reach data transfer rates at 250 MB/s. But if this same Red Lion device is moved and connected to a different network that’s having Cisco Catalyst switches, this Device is working fine. No retransmissions issue.

There are a lot of packet retransmissions happening just before the FTP application failing with error – BTW, I am using Filezilla client to transfer data to the FTP Box. Same is the case when browsing the FTP/HTTP site hosted on the Red Lion box via IE from my machines.

TCP_Retransmissions

Wireshark Analysis

I’ve analysed the network connection between these servers in question and noticed that there are a lot of packet retransmissions happening. TCP “RST” (RESET), “Spurious Retransmissions” (Source Retransmitted the packet even though the DEST ACK; assuming the DEST hasn’t ACK) are noticed in high numbers. This is not the case when I tried to capture traffic between the other sources.

TCP RST couldn’t be considered as the issue normally because this happens after every session closure. But in our case the packet retransmissions and failing communication are resetting the RPC port communication and thus these messages are seen. So obviously, in both success and failure cases we will see this kind of messages.

TCP Segment Length

TCP Segment Length

I have noticed that the Maximum Segment Size; MSS of the destination server – Redlion box is “1280” and the source server is “1460”. Pinging with 1460 without fragmentation to the destination server which has 1280 MSS value is responding fine; data that remote server responds with has same data length size – “data.len>1460” filter applied shows that ICMP data of 1460 is transmittable both ways. Both the source and destination servers acknowledged to communicate using 1280 MSS value as they should be per application protocols standards; verified this as per “tcp.len>1200” filter applied and could see traffic generated has no TCP segment length that is using higher segment size than 1280 size in the application communications and thus eliminating the possible MSS size issue for packet retransmissions.

portqry

Port Query Results

ICMP packets are fine, they don’t have any issues. Only FTP/HTTP traffic is getting affected. This means no issues until Network layer, but with Application/session layer the traffic is getting worse. And at times the Portqry too failing with Filtered messages on port 21 from Source to destination FTP box.

Right now I am doubting the Speed/duplex settings on these switches and VM Hosts. Our VM Hosts are 10G capable NICs and Switches too. It is hard-coded in Nexus switches regarding speed at VM Hosts interface, so technically switches are controlling the speed, so I got nothing to do on VM Hosts speed/duplex settings; anything I want to modify is left with Nexus switch.  End device Red Lion FTP box is only 100 MB Capable. Cannot blame if source talking at full 10 Gig speed and end device is failing to respond with same speed. Because the normal SYNC, ACK communication too getting affected with the TCP retransmissions; at this same time, I cannot assume this couldn’t be the reason. It still needs analysis to rule out things.

Worked with Cisco and they say Nexus switches don’t support buffering, so 10 Gig source and 100 MB destination don’t work in the nexus environment. Buffering is not capable they say in Nexus switches. An alternative they propose to fix is to update the IOS on these Nexus switches; but that’s tentative solution.


—— Update on 23rd Jan 2016—–

<<We’ve updated the Nexus IOS version to the latest, yet we see the same issues. Still banging head to get this fixed.>>


I will keep on updating this thread as more progress is made… Comments are welcome.


Cheers!

Chaladi


SQL cluster resources may be failing to start in the cluster with no specific error thrown when you are trying to start the SQL Service from the cluster window. If you Generate the cluster logs or in the Event viewer cluster logs you may see this annoying [RES] SQL Server <SQL Server (DTA)>: [sqsrvres] Failed to start service with error 1062. Please try again”


This error doesn’t really give you real clue what’s wrong with the SQL service. You may have to go to Application/System Event logs to find the real cause. The following error will be displayed in the logs section Unable to allocate enough memory to start ‘SQL OS Boot’. Reduce non-essential memory load or increase system memory.”

This means that there’s not enough memory available on the Cluster node to start the SQL services. You can either failover the SQL service/other concerned service to other participating node or increase the Memory of Cluster node if memory is being fully utilised.

Cluster Logs reads as below:

000011cc.00000568::2015/12/28-04:59:49.866 INFO  [RES] SQL Server <SQL Server (DTA)>: [sqsrvres] Dependency expression for resource ‘SQL Network Name (XYZ_NAME)’ is ‘([9876bf5f-f99d-4de9-84dd-1c286559d994])’
000011cc.00000568::2015/12/28-04:59:49.871 INFO  [RES] SQL Server <SQL Server (DTA)>: [sqsrvres] Starting service MSSQL$DTA…
00000a9c.00001be4::2015/12/28-04:59:50.164 INFO  [NM] Received request from client address CLUSTERNODE_1.
000011cc.00000568::2015/12/28-04:59:51.150 ERR   [RES] SQL Server <SQL Server (DTA)>: [sqsrvres] Failed to start service with error 1062. Please try again
000011cc.00000568::2015/12/28-04:59:51.150 INFO  [RES] SQL Server <SQL Server (DTA)>: [sqsrvres] SQL Server resource state is changed from ‘ClusterResourceOnlinePending’ to ClusterResourceFailed’
000011cc.00000568::2015/12/28-04:59:51.150 ERR   [RHS] Online for resource SQL Server (DTA) failed.
00000a9c.00001778::2015/12/28-04:59:51.150 WARN  [RCM] HandleMonitorReply: ONLINERESOURCE for ‘SQL Server (DTA)’, gen(1) result 5018/0.
000011cc.00000568::2015/12/28-04:59:51.150 INFO  [RES] SQL Server <SQL Server (DTA)>: [sqsrvres] Extended Event logging is stopped
00000a9c.00001778::2015/12/28-04:59:51.150 INFO  [RCM] Res SQL Server (DTA): OnlinePending -> ProcessingFailure( StateUnknown )
00000a9c.00001778::2015/12/28-04:59:51.150 INFO  [RCM] TransitionToState(SQL Server (DTA)) OnlinePending–>ProcessingFailure.


If the cluster nodes are VMs and you have Dynamic Memory configured on these VMs, then Live migrate the VM to a more capable VM Host to fix the Dynamic Memory not being allocated to the VMs by the cluster.


Any questions, please feel free to hit the comment section.


Hey thought to blog this to help some of the patrons who are facing issues while mounting NFS fileshare on their windows servers/desktops.

Note: Only Windows 7/8/8.1 Enterprise editions have “Services for NFS” in Turn Windows Features on/off settings.

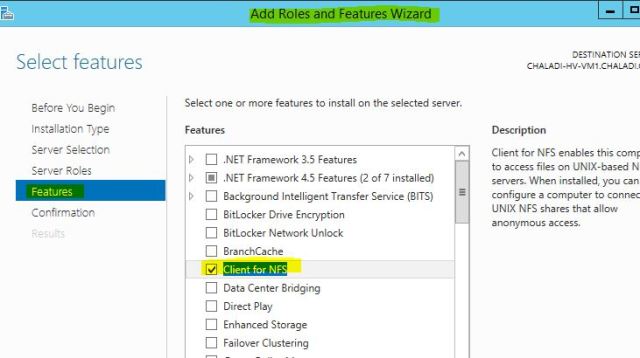
In Windows Server 2008/R2/2012/R2 editions you have to enable Client for NFS feature to get this issue fixed/to mount NFS fileshares in windows OS. Follow below steps to get this fixed.

NFS Fileshare Error


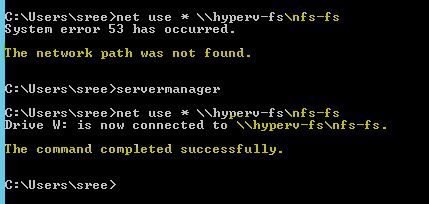
To mount NFS fileshare, you can either use net use command or mount command. “mount” command works only if NFS client is installed 🙂

Server Manager


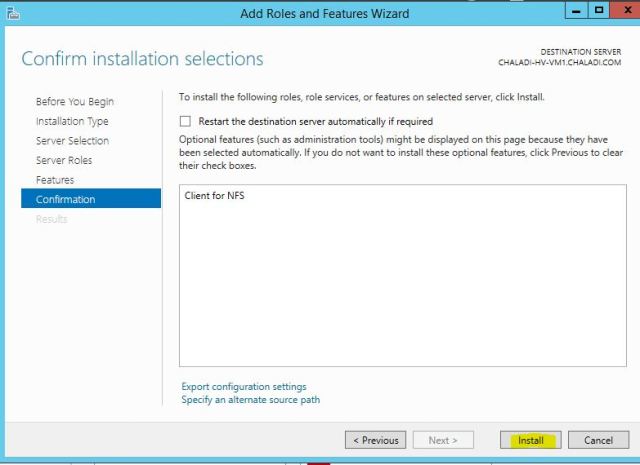
Launch Server Manager to install NFS client features.

Turn NFS Client Feature

Install NFS Feature

Install Success

NFS mount Success

Once Client for NFS is installed, the command works instantly without any reboots.

Let me know if you have any questions/issues getting NFS work.


Hello All,

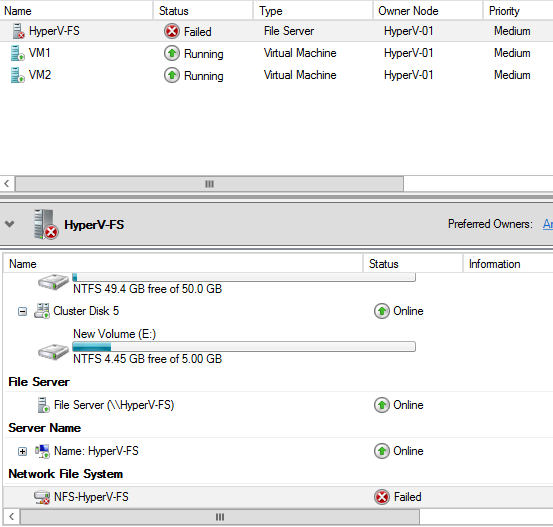
It’s been so long since I’ve wordpressed. The below short article wrote help to fix the 14202 errors in windows failover cluster – Titled “How-To Fix windows Failover cluster 14202 Event ID error”. Issue deals fixing One of the Cluster resources failed to start with this error in FCM (Failover Cluster Manager). It can be NFS / someother fileshare/disk based resource hosted on FCM.

Cluster Resource Failure

Upon looking at the Resources of this Failed Cluster resource, you can see that NFS/resource related to this is in failed state.

Resource Failed -1

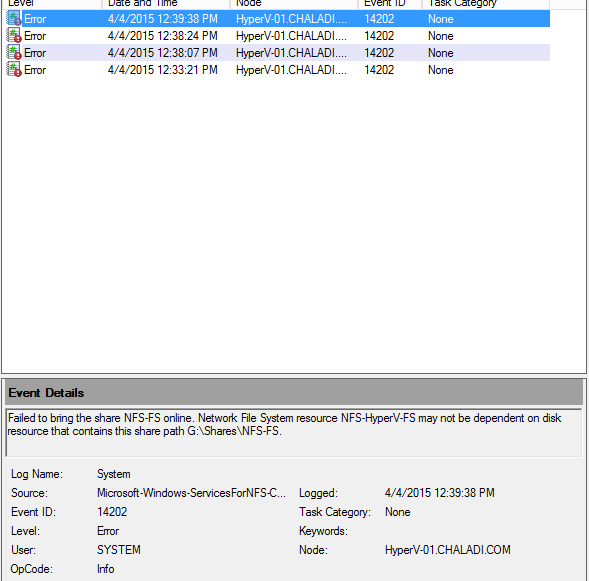
To see what’s causing the issue with NFS/related resource failures, you have to go to Cluster events to know more about the error cause.

Cluster Error Logs_Events

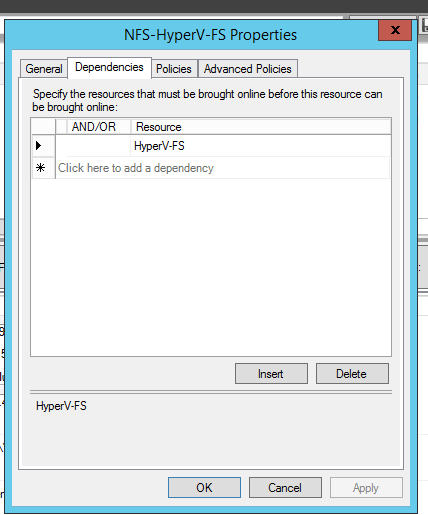
Now you see that NFS-HyperV-FS is not dependent on disk resource G:\shares\NFS-FS, so it is failing to get the cluster resource online as there is no dependencies for the NFS share we’ve configured to use for this NFS cluster resource. NFS file share works when it has dependencies/resources allocated to it.

Go to NFS resource properties as below and create dependency on the drive/share as below:

Cluster Dependency missing


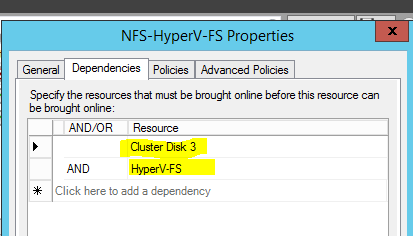
Now, click on Empty Resource field and drop down the menu there to select Cluster Disk/Disk presented to the NFS/Cluster resource in FCM (if there is only one filed here in Resource, Add One as required; click Insert to add empty fields). In my case Cluster Disk 3 is the one that is hosting the NFS shares. Click AND property to have the resource dependent on Disk explicitly; this means disk and NFS object name should be online to get the resource working (of course, if CNO (Cluster Name Object) alone is online, no use as share drive is offline 🙂 )

Cluster dependency set

So now we’ve set the Cluster DIsk 3/NFS share disk and HyperV-FS; that is computer object name for accessing the NFS. This should solve the dependency problem and help get the cluster resource online. Now try bringing the NFS resource online again from FCM and this should work now 🙂

Fixed NFS cluster

Please let me know if you have any questions/trouble fixing this kind of errors. You can always comment if you have issues with Failover Clusters in Windows or VMware.

%d bloggers like this: